Academy of Internet Finance (AIF), Zhejiang University
in partnership with
International Monetary Institute (IMI), Renmin University of China
The past year witnessed the sluggish recovery of world economy and increasing political risks across the globe, during which China has maintained an albeit moderate, evidently stabilizing economic growth. Admirable progress has been made in both the revolution of supply-side policies and the “Belt and Road initiative” along with strengthening cooperation amongst BRICS economies. Celebrating the trend, the third issue of its kind: East or West, Home is Best?—— Are banks becoming more global or local? is released.
The 2017 issue features the construction of a more compact Bank Internationalization Index (BII) as opposed to its preceding issues. Specifically, stock of overseas assets, performance of overseas operations and global layout, all of which are the main indicators of banks’ degree of internationalization, are selected for computing the primary BII. Indicators of less importance are integrated for computing a secondary index and further analysis.
While the preceding issues mainly focused on Global Systematically Important Banks (G-SIBs), the current issue also investigates Global Non Systematically Important Banks (G-NSIBs). With a global perspective and benchmarking global leaders, the report provides a comprehensive study of the internationalization of Chinese banks. It also contributes to the extant literature by analyzing the internationalization of banks at a global scale, exploring the causes and significance of bank internationalization, and eventually, offering constructive recommendations for banks’ internationalization strategies.
The 2017 report has drawn on data of 49 international banks, ranging from multinational banks with large scale of assets to medium or small-sized shareholding commercial banks at their initial attempts of overseas expansion. This corresponds to a wide continental coverage encompassing Europe, America, Asia as well as Africa. With such diversity, our dataset serves as a sound representative of global banks, hence the dynamics of BII is a good reflection of the bank internationalization development over the last decade.
Major Findings and Conclusions:
A snapshot of the BII dynamics:
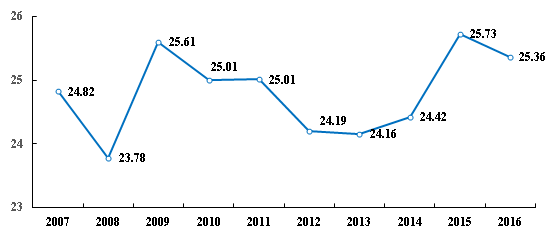
Notes: The data in the figure is the average BII of 49 banks across the world.
The BII has been fluctuating within a 23~26 band over the last decade, trending downwards with the contagious dissemination and aftermath of the financial crisis around 2009 but started picking up since 2013, followed by a slowdown since 2015.
In general, the high volatility and stunted growth of BII throughout the period might be attributed to the strategic contraction of globalization and the susceptibility of overseas operations in the event of adverse global shocks such as the global economic recessions over the recent years.
Banks from developed economies have maintained a stable and high level of internationalization. While developing economies have been catching up with remarkable achievements, the gap between the two is expected to remain large within the short horizon.
Comparison between developed and developing economies
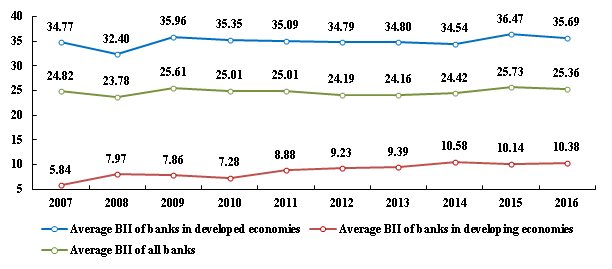
The gap between developed and developing economies is evident, with the former almost quadrupling the latter on average, yet the gap has been narrowing year by year.
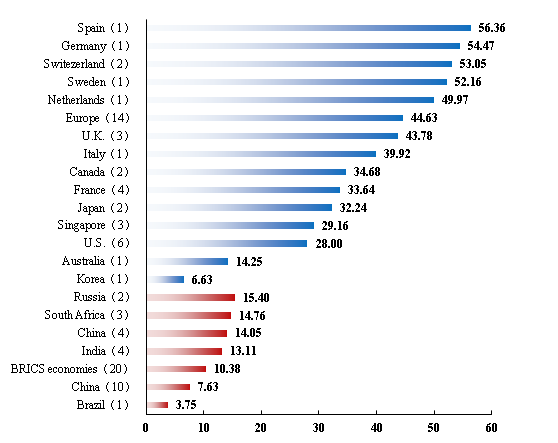
Notes: The blue bars in the figure stand for the average BII of banks from developed economies in 2016, the red bars stand for the average BII of banks from developing economies in 2016. The figure following the names of economies/districts/organizations in the vertical coordinates stands for the number of banks investigated in the BII system. China(4)stands for the 4 major state-owned commercial banks in China, China(10) stands for all the Chinese banks investigated in the BII system.
Amid the developed economies examined, European banks have performed the best while the disparity is less obvious among the developing economies with BRICS economies receiving a mean score of 10.38.
On the whole, the top 10 banks of 2016 BII ranking are either G-SIBs or those from developed economies, heavily dominated by European banks. Within developing economies, the top 10 banks are split among India and South Africa, both with 3 banks, as well as China and Russia, both with 2 banks.
G-SIBs leading the way in the global internationalization development scenery
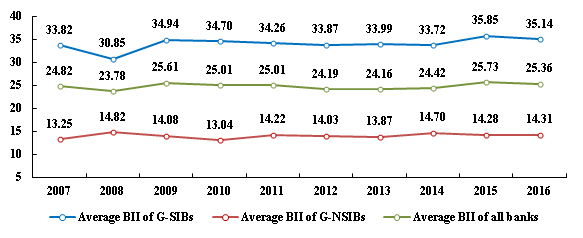
In terms of global leadership, the G-SIBs are proven to be dominating the internationalization development scenery, remaining on top of the BII ranking consistently, and scoring almost 2.5 times that of G-NSIBs.
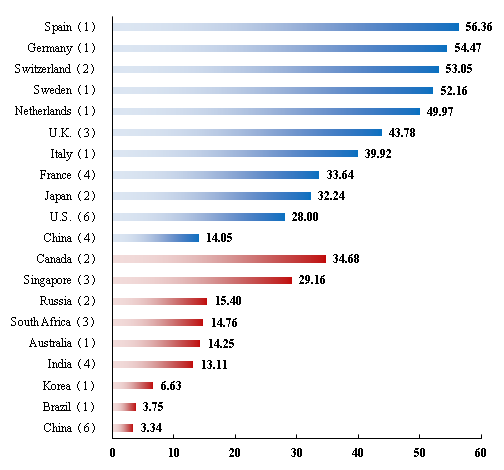
Notes: The blue bars in the figure stand for the average BII of the G-SIBs, the red bars stand for the average BII of G-NSIBs. The figure following the names of economies/districts/organizations in the vertical coordinates stands for the number of banks investigated in the scoring system. China(4) stands for the 4 major state-owned commercial banks in China, China(6) stands for the average BII of the 6 G-NSIBs in China.
Within the G-SIBs, Banco Santander in Spain has performed extraordinarily. G-SIBs from Germany, Switzerland, Sweden and Holland have all outperformed those from the U.K. and the U.S. When it comes to G-NSIBs, banks from Canada and Singapore stood out.
BII Rankings in 2016
| BII Rankings | All 49 Banks | G-SIBs | G-NSIBs | |||
| 1 | Standard Chartered | 67.46 | Standard Chartered | 67.46 | Scotiabank | 39.01 |
| 2 | Santander | 56.36 | Santander | 56.36 | OCBC | 31.82 |
| 3 | HSBC | 55.37 | HSBC | 55.37 | Bank of Montreal | 30.35 |
| 4 | UBS | 54.71 | UBS | 54.71 | United Overseas Bank | 30.03 |
| 5 | Deutsche Bank | 54.47 | Deutsche Bank | 54.47 | DBS | 25.61 |
| 6 | Nordea | 52.16 | Nordea | 52.16 | The Standard Bank of South Africa | 20.62 |
| 7 | Citigroup | 51.77 | Citigroup | 51.77 | Bank of Baroda | 18.14 |
| 8 | Credit Suisse | 51.38 | Credit Suisse | 51.38 | Vneshtorbank | 17.45 |
| 9 | ING Bank | 49.97 | ING Bank | 49.97 | Bank of India | 15.18 |
| 10 | Société Générale | 42.93 | Société Générale | 42.93 | Commonwealth Bank of Australia | 14.25 |
| BII Rankings | Banks from Developed Economies | Banks from Developing Economies | Chinese Banks | |||
| 1 | Standard Chartered | 67.46 | BOC | 26.62 | BOC | 26.62 |
| 2 | Santander | 56.36 | The Standard Bank of South Africa | 20.62 | ICBC | 15.96 |
| 3 | HSBC | 55.37 | Bank of Baroda | 18.14 | CCB | 8.25 |
| 4 | UBS | 54.71 | Vneshtorbank | 17.45 | BOC | 8.12 |
| 5 | Deutsche Bank | 54.47 | ICBC | 15.96 | ABC | 5.37 |
| 6 | Nordea | 52.16 | Bank of India | 15.18 | China Citic Bank | 3.92 |
| 7 | Citigroup | 51.77 | Sberbank | 13.35 | SPD Bank | 2.95 |
| 8 | Credit Suisse | 51.38 | Nedbank | 12.17 | China Merchants Bank | 2.63 |
| 9 | ING Bank | 49.97 | FirstRand | 11.51 | China Everbright Bank | 1.43 |
| 10 | Société Générale | 42.93 | State Bank of India | 11.46 | China Guangfa Bank | 1.01 |
Notes: Some data of Citigroup, Morgan Stanley, Bank of New York Mellon, Scitiabank and Vneshtorbank in 2016 is missing. The chart made reasonable predictions for their BII scores.
Nearly all the G-SIBs are from developed economies, with Chinese banks as the only exception. They have proven to be more influential and better recognized globally than their peers from developing economies, although their mean score of BII only halves that of the 6 American banks ranking right in front of them.
Appendix
BII Rankings of all 49 Banks in 2016
| BII Rankings | Banks | Countries | BII |
| 1 | Standard Chartered | U.K. | 67.46 |
| 2 | Santander | Spain | 56.36 |
| 3 | HSBC | U.K. | 55.37 |
| 4 | UBS | Switzerland | 54.71 |
| 5 | Deutsche Bank | Germany | 54.47 |
| 6 | Nordea | Sweden | 52.16 |
| 7 | Citigroup | U.S. | 51.77 |
| 8 | Credit Suisse | Switzerland | 51.38 |
| 9 | ING Bank | Netherlands | 49.97 |
| 10 | Société Générale | France | 42.93 |
| 11 | BNP Paribas | France | 40.18 |
| 12 | Unicredit Group | Italy | 39.92 |
| 13 | Scotiabank | Canada | 39.01 |
| 14 | Mitsubishi UFJ FG | Japan | 36.69 |
| 15 | Oversea-Chinese Banking Corporation | Singapore | 31.82 |
| 16 | Goldman Sachs | America | 31.59 |
| 17 | Groupe Crédit Agricole | France | 31.07 |
| 18 | Bank of Montreal | Canada | 30.35 |
| 19 | United Overseas Bank | Singapore | 30.03 |
| 20 | Mizuho FG | Japan | 27.79 |
| 21 | Bank of China | China | 26.62 |
| 22 | JP Morgan Chase | U.S. | 25.95 |
| 23 | Development Bank of Singapore | Singapore | 25.61 |
| 24 | Morgan Stanley | U.S. | 23.00 |
| 25 | Bank of New York Mellon | U.S. | 20.63 |
| 26 | The Standard Bank of South Africa | South Africa | 20.62 |
| 27 | Groupe BPCE | France | 20.39 |
| 28 | Bank of Baroda | India | 18.14 |
| 29 | Vneshtorbank | Russia | 17.45 |
| 30 | Industrial and Commercial Bank of China | China | 15.96 |
| 31 | Bank of India | India | 15.18 |
| 32 | Bank of America | U.S. | 15.08 |
| 33 | Commonwealth Bank of Australia | Australia | 14.25 |
| 34 | Sberbank | Russia | 13.35 |
| 35 | Nedbank | South Africa | 12.17 |
| 36 | FirstRand | South Africa | 11.51 |
| 37 | State Bank of India | India | 11.46 |
| 38 | Royal Bank of Scotland | U.K. | 8.51 |
| 39 | China Construction Bank | China | 8.25 |
| 40 | Bank of Communications | China | 8.12 |
| 41 | Punjab National Bank | India | 7.65 |
| 42 | Shinhan Bank | Korea | 6.63 |
| 43 | Agricultural Bank of China | China | 5.37 |
| 44 | China Citic Bank | China | 3.92 |
| 45 | Bradesco | Brazil | 3.75 |
| 46 | SPD Bank | China | 2.95 |
| 47 | China Merchants Bank | China | 2.63 |
| 48 | China Everbright Bank | China | 1.43 |
| 49 | China Guangfa Bank | China | 1.01 |
Notes: Some data of Citigroup, Morgan Stanley, Bank of New York Mellon, Scitiabank, Vneshtorbank and Sberbank in 2016 is missing. The chart made reasonable predictions for their BII scores.

